
Okay, grab your coffee (or tea, I won’t judge). Let’s talk about graphing piecewise functions. You know, those functions that act like they have multiple personalities? One minute it’s a straight line, the next it’s a curve, and then—poof—it vanishes.
Desmos is our best friend here. It’s the math equivalent of a Swiss Army knife, except less stabby and more colorful graphs. I love using Desmos for piecewise functions because it does the heavy lifting glitch-free. No more crying over graph paper.
What Exactly Is a Piecewise Function?
Think of it like a choose-your-own-adventure book. For certain x values, you follow one rule. For other x values, you follow a completely different rule. It’s like your friend who’s a gym rat before noon but a couch potato after 3 PM—distinct zones.
Must Read
In math terms? A function defined by multiple sub-functions, each applying to a specific interval. Boring definition. Exciting results.
The Magic Desmos Syntax
Here’s the secret sauce. Desmos uses curly braces { } to set conditions. You type the function, then the condition inside those braces. Example: y = x + 1 {x < 0}. That’s it. The graph only shows up for negative x values.
Want two pieces? Just add another line. Or, if you’re feeling fancy, use a single line with multiple conditions. Like this: f(x) = {x < 0: x+1, x >= 0: x^2}. That colon (:) acts like a “then” command. It’s dangerously simple.
Pro tip: Don’t forget the commas between conditions. Desmos will ghost you and give you an error if you skip them. It’s petty like that.
Step 1: Open Desmos and Relax
Go to desmos.com. Don’t panic. The blank grid is your blank canvas. Breathe. You’re not back in high school detention.
Click into the first expression line. Type your first piece. Let’s say: y = 2x + 1 {x <= 3}. Boom—a line appears only up to x = 3. You can drag the little blue dot at the endpoint to adjust the boundary visually. How cool is that?
Step 2: Stack the Pieces
Now add a second line. Type: y = 5 {x > 3}. This gives you a flat horizontal line for all x greater than 3. You now have a weird but beautiful function that climbs, then goes flat. Congratulations—you just Frankensteined a function.
Want to add a third piece? Go for it. Desmos doesn’t judge. Add a parabola, a sine wave, even a polar petal. Just remember the curly braces and the colon if you’re using the compact syntax.
Dealing with “Open” vs. “Closed” Circles
This is where students usually sweat. An open circle means the point is not included. A closed circle means it is. In Desmos, you use inequalities: < or > for open; <= or >= for closed.
Mistype a sign? Your graph will look like it has a tiny hole, like a donut missing a sprinkle. Fix it by changing < to <= in the condition. Desmos updates instantly. Magic, I tell you.
How to Check Your Work
Slap a table on it. In Desmos, add a table from the “+” menu. Type in x values around your boundaries. The y-values should switch rules exactly where you expect. If one says “undefined,” you missed a condition.
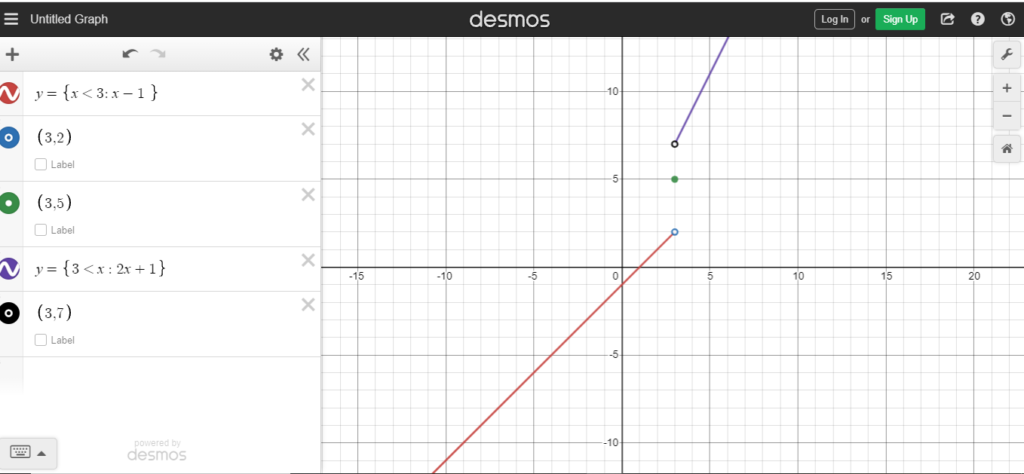 How to do piecewise functions on Desmos Graph Calculator?
Another trick: graph the pieces in different colors. Click the color circle next to each expression and assign a wild color. Now you can see exactly where the blue line ends and the red parabola begins. It’s like function traffic control.
A Real-World, Slightly Exaggerated Example
Imagine you’re tracking your daily soda intake. For hours 0–3 (sleeping), consumption is zero: y = 0 {0 <= x < 3}. For hours 3–12 (work), it’s a caffeine-fueled nightmare: y = 2x {3 <= x < 12}. After 12, you crash: y = 0.5x + 1 {x >= 12}.
Graph it, share it, and let your friends judge your life choices. Piecewise functions are secretly about storytelling. Your graph tells a story of a person who peaks at noon and naps by dinner.
Common “Desktop” Disasters (And Fixes)
Forgot the curly braces? Desmos will scream “invalid.” Slow down. Type y = x^2 {x < 0}, not y = x^2 x < 0—that’s gibberish.
Using the wrong bracket? It only accepts curly braces {}, not square brackets or parentheses. Square brackets are for angry math teachers. Curly braces are for friendly mathematicians.
Your graph is blank? You might have typed the interval backwards, like {x > 5} when you meant {x < 5}. Swap the inequality. Sometimes the simplest fix is the one you overlook while sipping cold coffee.
Why Desmos Beats Paper (And Everything Else)
Paper is the enemy of trial and error. With Desmos, you can tweak a function fifty times in a minute. Drag sliders, change conditions, swap piece order—it’s all undoable. The only risk is accidentally refreshing the page and losing your masterpiece. Save often, my friend.
Also, you can share a link. Send your piecewise function to a friend without describing it in awkward hand gestures. They click, they see the insanity. It’s the modern equivalent of pulling out a folded graph from your pocket.
Final, Very Casual Thoughts
Graphing piecewise functions in Desmos is less “math homework” and more “digital art project.” You are a sculptor, and the axes are your clay. The curly braces are your chisel. The colors are your paint.
So go ahead. Graph a function that dips, spikes, and flatlines like a heartbeat. Or make one that looks like a staircase. You have the power. And if you mess up? Desmos doesn’t care. Neither should you.
Now, refill that cup and start graphing. And remember: if the piecewise function gives you a headache, just zoom out. Sometimes the solution is just perspective—and less caffeine.